- General overview
- Layers Selection
- Filter Data
- Search places
- Explore Toponyms
- Download data
- Print map
We present here a general overview on how to use the EGYLandscape webGIS map interface in order to browse the evolution of the Egyptian landscapes from the 13th century until today. Other sections of this “Help” page, available on the left panel, dive into more details about the different tools available on this platform.
As for most web maps available online, the map area (presented in the background) allows you to pan the map by clicking on an area and dragging your mouse to move the view in the opposite direction. Note that when hovering over mapped features, some may highlight and clicking on them will allow you to access the information attached to them (see the “Explore Toponyms” section on the left). The mouse wheel can also be used to zoom in or out on the map.
A number of tools and controls are overlaid on the map, which are detailed below:
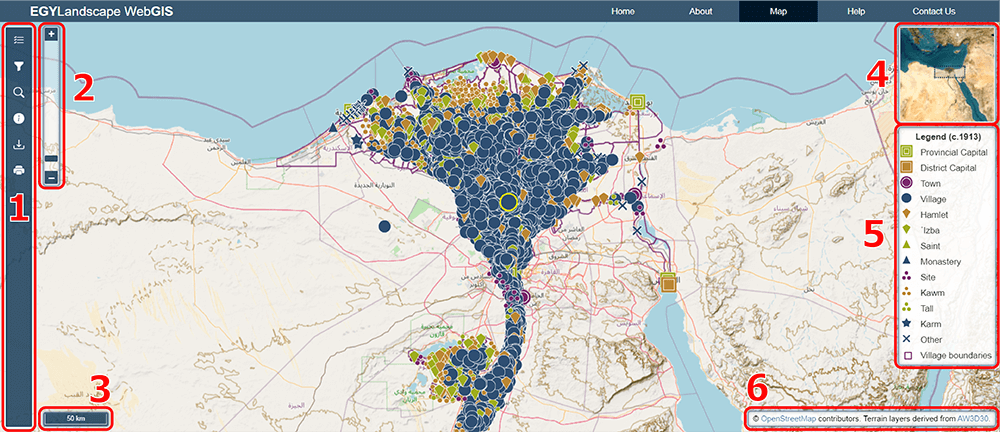
- The sidebar hosts the main tools on the maps, allowing you to choose the data to be displayed on the map, filter toponyms, search for a specific place, access more information on mapped features, download datasets or export/print the current map. All these tools can be accessed by clicking the corresponding icon on the sidebar, which will open the relevant panel. Details on each of these tools are provided in different sections available on the left of this page.
- A zoom control is also available to zoom in or out on the map, either by clicking the +/- signs, or by clicking and dragging up or down the middle bar located in between them. This bar also provides an insight to your current zoom level on the map. This control complements the mouse wheel tool to adjust the zoom level of the map.
- The scale bar automatically adjusts with the zoom level and gives the correspondence between the distance on the map and the actual distance on the ground.
- An overview map is provided at a lower zoom level to locate the current map view in a broader context. It can also be used to pan the map by dragging around the box displaying the map extent.
- The legend updates automatically with the data displayed and defines the symbols used to represent the different features on the map.
- Lastly, an attribution panel sources some external data and datasets that are being used in the webGIS when they are displayed on the map.
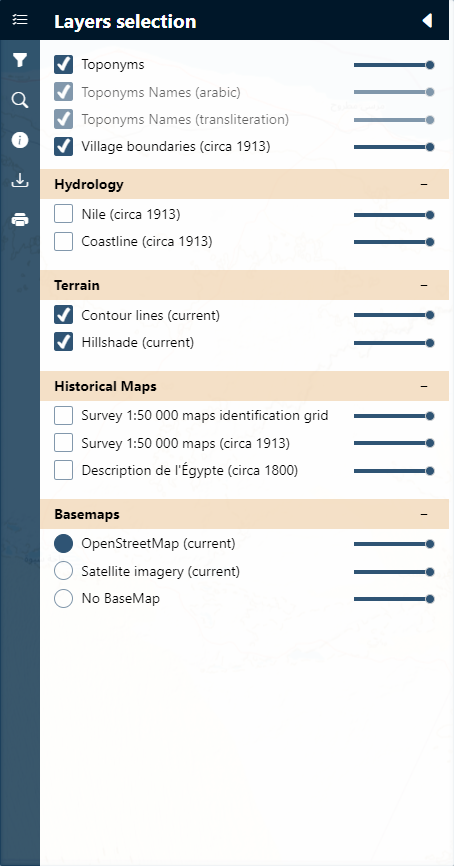
The Layer selection panel (first item on the sidebar) allows the user to select the data layers to be displayed on the platform, by checking or unchecking the different layers. Note that on the right of each item is a transparency bar, adjustable by dragging its cursor to set the opacity of the corresponding layer.
Layers are organized by thematic groups (e.g., Terrain, Hydrology, etc.) which can be collapsed or expanded by clicking on the group title.
Different types of data layers are available:
Layers are organized by thematic groups (e.g., Terrain, Hydrology, etc.) which can be collapsed or expanded by clicking on the group title.
Different types of data layers are available:
- Basemaps are the background information which appears behind the map, either set to the OpenStreetMap overlay, Satellite Imagery, or No Basemap.
- Historic Maps can also be displayed behind the data, such as mosaics of the Survey of Egypt 1:50,000 maps or of the Atlas de la Description de l’Egypte. An identification grid of the Survey maps can also be displayed, which details their respective extent, number, and date of publication.
- Terrain layers are derived from current elevation data acquired by satellite and can be used to give an insight of the terrain, either through a hillshade or a set of contour lines adaptive to the zoom level (more details are displayed when zooming in).
- Hydrological data were digitized from the Survey maps and can provide an overlay of the location of the Nile and the coastline in the early 20th century.
- Administrative units (or village boundaries) are also derived from the Survey maps and provide an insight of the territorial organization of Egypt at this time.
-
Lastly, the Toponyms and Village boundaries layer displays the historical gazetteer developed for this project. It gathers all the places which can be precisely located (others may exist but cannot be presented on the map) with the information acquired from all of the medieval and contemporary textual and cartographic sources used in this project (see About page). The database entries for each of these places can be accessed by clicking on a data point or polygon on the map (see the Explore Toponyms section of this page).
Note that two Toponym Names are also available to display the names of each place in arabic or transliterated characters based on the selected source in the Filter Toponyms panel. These layers will only be available if a single source has been selected. The names will only appear on the map when it is zoomed in enough (to avoid overcrowding), otherwise the layers will be greyed out in the Layer selection panel.
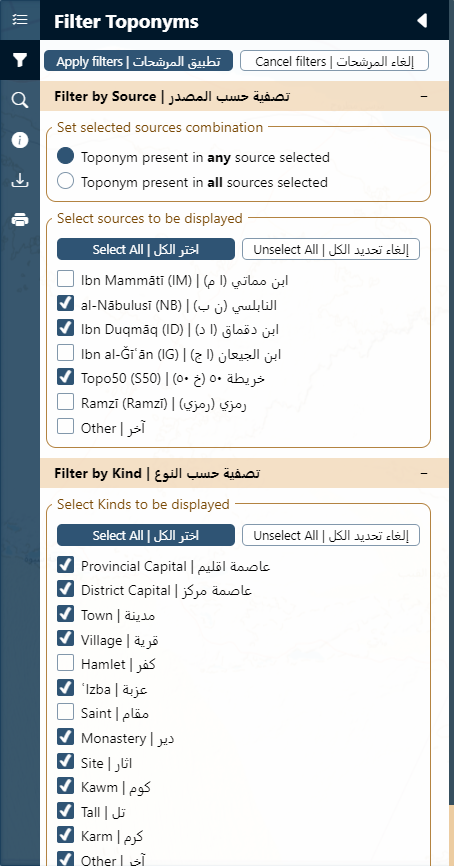
The Filter Toponyms panel (second item on the sidebar) allows for filtering the historical gazetteer database in order to display on the map only those entries that meet the criteria set on this panel. Three different entry points can be set, alone or in combination: filtering the data by sources, by kind, and/or by the province (see detail below). These options are collapsed by default, but clicking on a title (e.g., “Filter by Source”) allows the user to expand its content so that conditions can be selected by checking or unchecking them. Once all filters are set, the Apply filters button at the very top of the panel must be clicked. The Cancel filters button reset the maps and condition to default.
The filter by source section permits the selection of the different primary data sources used to build the EGYLandscape webGIS historical gazetteer (see About page). Note that in this section, an additional source combination criterion has to be set, i.e. filtering the toponyms which are described in any of the selected sources or which must be present in all of them.
The filter by kind section allows the user to select the type of places to be displayed. Note that when combined with a single source filter, it will display only the toponyms of that specific kind in that source (e.g., villages in IM), but when combined with a multiple source filter, the places of that kind in any of the selected sources will be retained (e.g., a village in either IM or ID). Selecting multiple kinds will look for any of these kinds in the selected sources and/or provinces.
The filter by province section allows filtering by province, either modern or pre-modern. These administrative filters, single or multiple, combine with other kind or source filters as described above.
Note that for all these sections, a Select all and an Unselect all buttons are available for an easier selection of the filtering criteria.
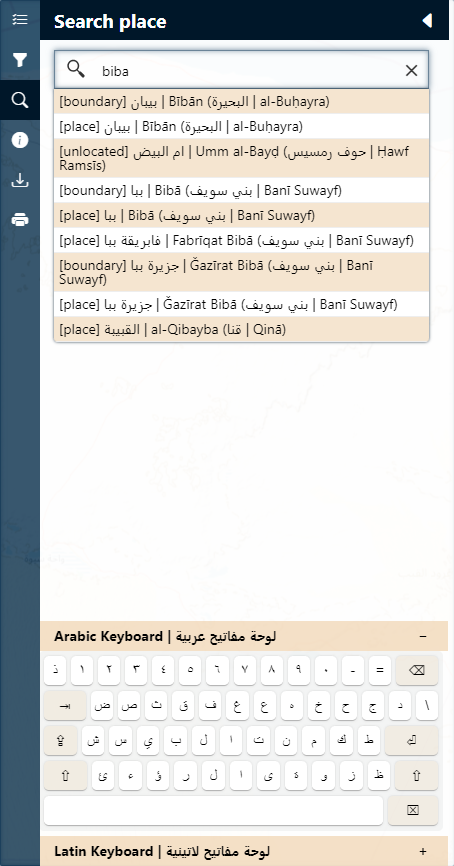
The Search place panel (third item on the sidebar) allows the user to search for a name in all of the toponyms present in the historical gazetteer. While typing, a set of results will appear, which may be different from what is written in the case that the latter is stored in our database as an alternative or variant name (see Key concepts section of the About page). Precision is given on the province the searched place is located in to avoid possible confusion with homonyms. The type of geometry is also displayed in brackets, either a [place] (point data), a [boundary] (village polygon data), an [island] (polygon data) or [unlocated] if the place is not georeferenced in the webGIS (e.g., disappeared villages).
Selecting a proposed search result will open their attribute information (see Explore Toponyms section). Unless no geolocation is available, the map will also zoom to the selected toponym.
Note that the search bar accepts entries in either roman or Arabic characters. Virtual keyboards are available at the bottom of the panel in both languages and including transliteration characters (click on their title to expand them if need be).
Entering a placeID unique identifier in the search bar is also an option.

The Explore Toponyms panel (fourth item on the sidebar) is the place where the associated information with any mapped feature is displayed. Note that this panel is empty by default, as a feature has first to be selected on the map (by clicking it) or in the search panel to show the database entries for it. Selecting or searching a feature will also automatically open this panel.
Displayed information includes the place's unique identifier, a list of all names attached to it, the sources in which it is found, and a similarly sourced list of alternative names (or variant), of kind, administrative status, and the administrative divisions in which the feature is located depending on the source. A historical note may be available. The author of the database entry is also displayed, as well as a complete list of the references to this toponym in all sources providing information on it.
Displayed information includes the place's unique identifier, a list of all names attached to it, the sources in which it is found, and a similarly sourced list of alternative names (or variant), of kind, administrative status, and the administrative divisions in which the feature is located depending on the source. A historical note may be available. The author of the database entry is also displayed, as well as a complete list of the references to this toponym in all sources providing information on it.
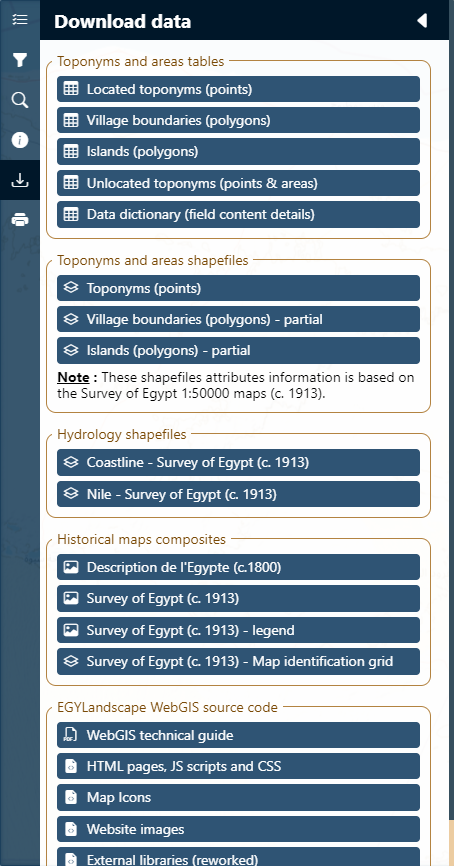
All the data gathered by the EGYLAndscape WebGIS project are available for download through the download data panel (fifth item on the sidebar). Available datasets include:
-
Toponyms and area tables are CSV spreadsheets compiling all the textual information gathered in the EGYLandscape WebGIS project. They are divided into located toponymes (points), village boundaries (polygons), islands (polygons) and unlocated toponyms. An additional Data dictionary table provides descriptions of the content of the columns for the above mentionned tables.
Data available in the spreadsheet are formated as in the Explore Toponyms panel. These spreadsheets can be joined to the relevant geographic data (shapefile, see below) within a GIS software using the PlaceID unique identifier. - Toponyms and area shapefiles are GIS-ready data for geolocating features as point data (toponyms) or polygon data (village boundaries and islands). The attribute table of these layers refer to the information provided in the Survey of Egypt 1:50000 maps (c. 1913), but this information can be extended to include all sources used in this project by joining the above-mentionned spreadsheets.
- Hydrology shapefiles are also provided, delineating the coastline and the Nile as per the Survey of Egypt 1:50000 maps (c. 1913).
- Historical basemaps composites can be downloaded from the David Rumsey map collection as the download buttons present in this section just targets to the relevant webpages. In addition, a shapefile delineating the extent of each Survey of Egypt 1:50000 map is provided, in case the end-user is only specific map(s) rather than the whole collection.
- Lastly, EGYLandscape source code and a technical guide are provided for other projects to re-use and adapt to their specific needs.
The print map (last item on the sidebar) can be used to export the map while maintaining the currently displayed and set data filters. It opens a pop-up where the right section shows the map to be exported, while the left section gives the opportunity to set a number of export options, such as the page orientation, paper size, margins, as well as setting a specific map scale and showing or hiding map overlays (scale, orientation and legend).
Once all parameters are set, the map can be exported as an image (jpeg or png), as a pdf, or copied to the clipboard for pasting in into a document. Please, keep the EGYLandscape WebGIS attribution when using such exported pictures.
Once all parameters are set, the map can be exported as an image (jpeg or png), as a pdf, or copied to the clipboard for pasting in into a document. Please, keep the EGYLandscape WebGIS attribution when using such exported pictures.
